Debunking London's 'ULEZ-Impact'
Are the Mayor's claims about the air pollution benefits from the ULEZ based on sound science or distorted mathematics?
‘‘The 1.3% and 3% reductions cited in these independent studies represent staggering differences from Mayor Khan’s claims of almost 50% reductions in NO2 concentrations!’’
Summary:
In February of this year the London Mayor published a report that quantifies the benefits of his Ultra Low Emission Zone (ULEZ)1, one year after it was expanded to cover inner as well as central London.
The ULEZ is credited with incredible benefits, such as it having ‘considerable impact in reducing nitrogen dioxide levels, with central London NO2 concentrations reducing by 46 per cent’.
The methodology used to determine the ‘ULEZ impact’ appears, however, to be based on a fundamentally false assumption and applies distorting mathematics that has the overall effect of boosting the claimed ULEZ benefits.
Other independent studies have quantified the benefits of the ULEZ, but they produced results that are more than an order of magnitude lower than those boasted by the Mayor.
Background
The report titled ‘Inner London ULEZ Expansion 1 Year Report’, or ‘the ULEZ report’ as I refer to it here, has provided no end of headline-grabbing claims in advance of the proposed ULEZ expansion across the entire Greater-London Area.
As an air pollution scientist I was curious about the methodology behind such extraordinary claims. I also admit to having been somewhat suspicious as to the magnitude of the boasted ‘ULEZ impact’.
Simplified statements made about the dangers of air pollution as well as the miracle political policies there to protect us are, unfortunately, like barbed fishhooks… they embed themselves easily, but are much more difficult to unpick!
Nonetheless, this article is my attempt to unpick just one aspect of the ULEZ claims. I would recommend you check some of the material compiled by Climate Debate UK and the Together Declaration that challenges some of the Mayor’s other claims:
The Mayor’s repeated claim that ‘4,000 Londoners die each year from air pollution’ is challenged in the first of three reports on the the Together Declaration site.
The success of the ULEZ and it’s expansion is questioned owing to the use of unreliable data in it’s assessment, more details of which can be found in the third of three reports on the the Together Declaration site.
1. The ‘ULEZ Impact’
In this article I focus on the methodology used to determine the so-called ‘ULEZ impact’, i.e., the benefits to air quality due to the implementation of ULEZ and it’s expansion.
Here I refer only to the claims made about nitrogen dioxide (NO2) reductions in central London, but my arguments can be equally applied to the claims made about particulate matter (PM) in inner, as well as central London.
What is the ‘ULEZ impact’?
In the simplest terms, the study looks at actual, measured pollutant concentrations in central London, and compares them to what the concentrations would be in a hypothetical scenario in which ULEZ was never implemented.
The difference between these two scenarios is called the ‘ULEZ impact’
How do you determine a central London ‘no-ULEZ’ scenario?
Given that the ‘no-ULEZ’ scenario is hypothetical (i.e. the ULEZ has been implemented), pollutant concentrations in central London cannot be determined by measurement so they must therefore be calculated.
The hypothetical ‘no-ULEZ’ scenario pollutant levels in central London are assumed to fall* at the same rate as the pollution concentrations in outer London, where there has been no ULEZ.
*Air pollution in cities generally decreases over time driven largely by the gradual replacement of older vehicles to newer, less polluting ones.
HOWEVER…
It turns out that determining the rate at which concentrations in outer London have fallen over time - despite having access to a network of sophisticated measuring stations - isn’t as straight forward as one might think!
At least not according to the methodology used in the ULEZ Report.
The ‘roadside increment’
Since ULEZ is a vehicle-specific policy, any changes to the fleet composition and/ or volumes of traffic owing to ULEZ would manifest most clearly in roadside pollutant concentrations.
Roadside pollutants are measured directly by monitoring devices, but these aren’t, apparently sufficient. In order to isolate, within these measured values, the contribution of purely vehicle-derived pollutants, a separate metric called the ‘roadside increment’ has been introduced.
‘‘The roadside increment isolates the changes in concentration at the roadside from changes in background concentrations’’ ULEZ Report, 2023
It is in the attempt to apportion the purely vehicle-derived pollutants within the roadside measurement values that introduces a false assumption into the process resulting in a mathematical distortion of reality.
2. Mathematical Trickery
When two plus two DOES NOT equal four!
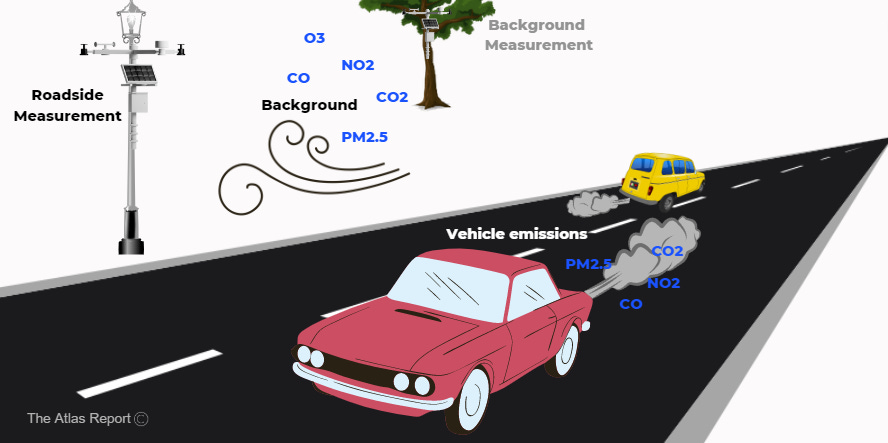
Pollutant concentrations are measured along roads and are called simply ‘roadside concentrations’. These concentrations are derived from pollutants present within the vehicle emissions, as well as pollutants present in the ambient background air, called the ‘background concentration’ (which is also measured).
The study methodology assumes that the pollutant concentration measured at the roadside (‘roadside concentration’) is the product of adding together the pollutant concentration measured in the background air (‘background concentration’) and the pollutant concentration coming from the vehicles (‘vehicle increment’):
roadside concentration = roadside increment + background concentration
Given that we have measured values for the roadside concentration and background concentration, a simple rearrangment of this equation can therefore derive the roadside increment.
But herein lies a false assumption.
Concentrations are not additive!
When a mixture of gases (a ‘plume’) is emitted from a source such as a road, it will disperse outwards by mixing with the surrounding, ambient (background) air. This process will dilute the pollutant concentrations that were within the plume. The plume’s concentration will approach that of the background, rather than ‘add’ to it, as illustrated in the figure below.
In other words, the concentrations of pollutants in mixing bodies of air are not additive.
Mathematical distortions
So what are the implications of using the roadside increment to represent vehicle-only derived pollutant concentrations in the context of calculating a ‘ULEZ impact’?
I believe that the roadside increment metric artificially reduces the rate of decline of pollutant concentrations over time.2
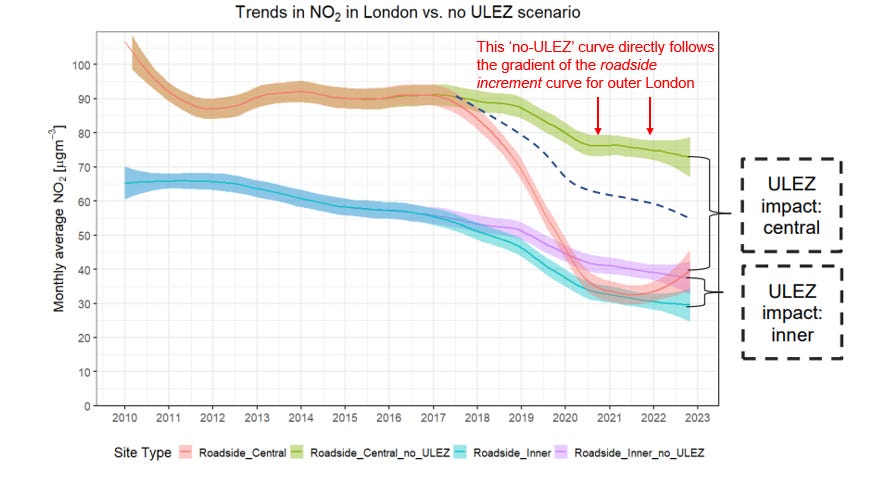
For example, looking at the rate of change of the actual measured roadside concentrations vs the rate of change of the mathematically derived roadside increments you can see that the latter (orange line) reduces at a lower rate than the former (blue line).

If the rate of decline is lower (flatter curve) for the roadside increment values over time, then so to will the hypothetical roadside concentrations used for the central London ‘no-ULEZ’ scenario.
If central London’s ‘no-ULEZ’ scenario curve had a higher rate of decline, as denoted by the blue dashed line that I added in the figure above (which roughly corresponds with the roadside measurement values) then you can see how the ‘ULEZ impact’ would be significantly reduced.
THE NET EFFECT: by using the roadside incremement value to determine the ‘no ULEZ’ scenario, the ‘ULEZ impact’ has been enhanced!
3. Conclusions
Other studies
Other groups have also attempted to quantify the ‘ULEZ impact’ - notably not by repeating the roadside increment-based method.
Here are a couple of examples:
1. Jacobs:
International engineering consultancy giant, Jacobs, undertook a study based on predictive modelling looking at the likely air quality benefits from the expanded ULEZ and concluded:
The results indicate that the Proposed [ULEZ] Scheme.. to result in a minor reduction (-1.3%) in the average exposure of the population of Greater London to NO2 and negligible reductions (-0.1 per cent) in average exposure to PM2.5. Similar changes are modelled to occur within central, inner and outer London.. Jacobs, ULEZ Integrated Impact Assessment, 2022
2. Liang Ma et al
A paper by Liang Ma et al from 2022 used advanced statistical analysis combined with data from London’s network of air pollution monitors to determine the impact that the ULEZ has had on pollution levels across the capital:
‘‘We observe that the ULEZ caused only small improvements in air quality in the context of a longer-term downward trend in London's air pollution levels…
..across London, we find an average reduction of less than 3% for NO2 concentrations, and insignificant effects on.. PM2.5 concentrations.’’ Liang Ma et al 2021 Environ. Res. Lett. 16 124001
The 1.3% and 3% reductions cited in these independent studies represent staggering differences from Mayor Khan’s claims of almost 50% reductions in NO2 concentrations!
You cannot isolate the impacts of ULEZ
I will finally point out that despite the London Mayor crediting air pollution miracles *exclusively to his ULEZ policy*, even his own report from which he quotes is careful not to make such bold claims!
Here are a couple of examples:
Therefore, the analysis… should be taken as showing the impacts of not just the central London ULEZ and its expansion, but of all the Mayor’s policies to reduce emissions from transport
This is an estimate for the impact in central London of the… expansion of the ULEZ *and other policies including upgrading the bus fleet and the increase in zero emissions taxis* [sic]
But why get bogged down with such annoying detail when there are political points that need scoring, and an ULEZ that needs expanding, right Mr Khan?!
Be careful out there!
-T
The Ultra Low Emission Zone is an area of London where a daily fee is charged for vehicles that don’t meet emissions threshold criteria. The scheme was first implemented in April 2019 covering central London, and then extended in October 2021 to cover inner London. The Mayor plans on extending the zone to cover outer London by August of this year.
The calculation of the roadside increment doesn’t consider that the background concentration of pollutants is also be influenced by vehicle-derived emissions. As vehicle-derived emissions gradually reduce, so too will a proportion of the background levels. To use this method, any vehicle influence should be removed from the background concentration before it is subtracted from the roadside concentration to calculate the roadside increment.


